Python Matplotlib tutorial with example
Python matplotlib library provides tools for data visualization; we can easily produce different type of char with different form of data. In this tutorial, you will learn how to use plotting in python programming.
Plotting in python programming can be used for various aspects like in data analytics, data science, machine learning etc.
You can install matplotlib in your local python environment using command pip install matplotlib.
To check which version of library have been installed in your development environment, just run following commands
import sys
print('Python: {}'.format(sys.version))
# install  matplotlib
import matplotlib
print('matplotlib: {}'.format(matplotlib.__version__))
Check full list of matplotlib pyplot functions
pyplot module of matplotlib library
You need to import pyplot package from matplotlib assembly.
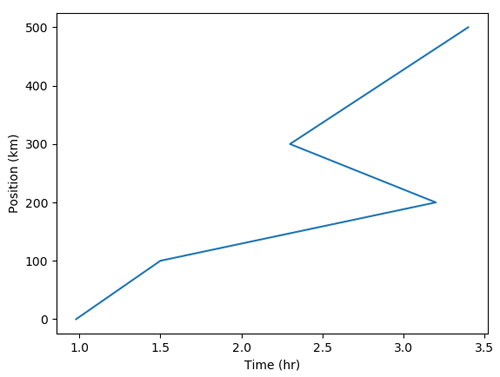
Here is a simple example of how you can use plotting in python, I have two list variable, x-axis for Time (hr) and y-axis for Position (km).
from matplotlib import pyplot

time = [.98, 1.5, 3.2, 2.3, 3.4]
position = [0, 100, 200, 300,500]

pyplot.plot(time, position)
pyplot.xlabel('Time (hr)')
pyplot.ylabel('Position (km)')

pyplot.show()
The output of above plotting will look like picture below.

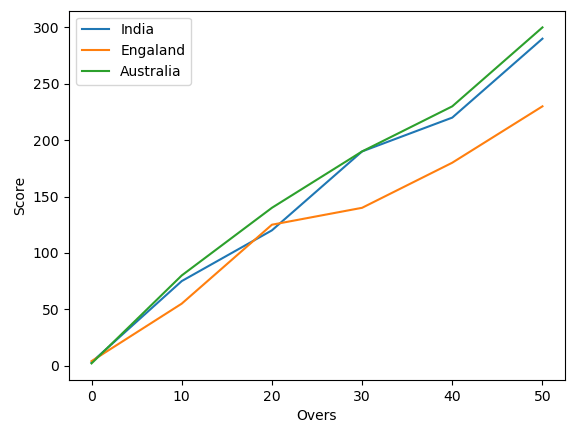
we can use plotting with multiple dataset on same figure, for example think of cricket score for 50 over match, we have dataset for three or more countries , look at the example below
overs = [0, 10, 20, 30, 40, 50]
indiaScore = [3, 75, 120, 190, 220,290]
engalandScore = [4, 55, 125, 140, 180,230]
australiaScore = [2, 80, 140, 190, 230,300]
As you can see we have scores for India, England and Australia as described above, now we can plot multiple dataset.
overs = [0, 10, 20, 30, 40, 50]
indiaScore = [3, 75, 120, 190, 220,290]
engalandScore = [4, 55, 125, 140, 180,230]
australiaScore = [2, 80, 140, 190, 230,300]


pyplot.plot(overs, indiaScore, label='India')
pyplot.plot(overs, engalandScore, label='Engaland')
pyplot.plot(overs, australiaScore, label='Australia')
pyplot.xlabel('Overs')
pyplot.ylabel('Score')
pyplot.legend()
pyplot.show()

Notice, in above example we have used plot function pyplot.plot(overs, indiaScore, label='India') to display chart.
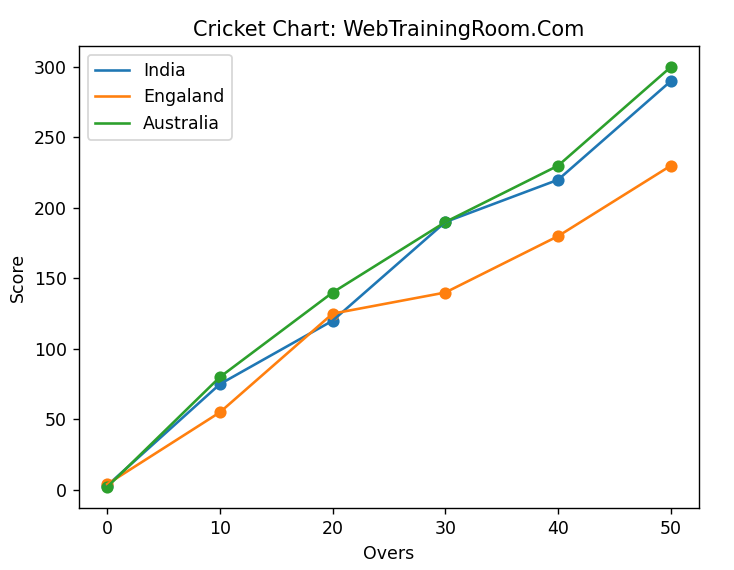
We also can use scatter function pyplot.scatter(overs, indiaScore, label='India') to display dotted spot, or you can use both functions to make beautiful visualization like example below.
pyplot.plot(overs, indiaScore, label='India')
pyplot.plot(overs, engalandScore, label='Engaland')
pyplot.plot(overs, australiaScore, label='Australia')
pyplot.scatter(overs, indiaScore)
pyplot.scatter(overs, engalandScore)
pyplot.scatter(overs, australiaScore)
pyplot.title("Cricket Chart: WebTrainingRoom.Com")
pyplot.xlabel('Overs')
pyplot.ylabel('Score')
pyplot.legend()
pyplot.show()

In plot function we also can specify linewidth, line style, color etc.
pyplot.plot(overs, indiaScore, label='India', linewidth=1.0, linestyle='--', color='red')
If we want the chart to be a specific size, we can specify figure like
pyplot.figure(figsize=(12, 8))
pyplot.plot(overs, indiaScore, label='India')
pyplot.scatter(overs, indiaScore)
Figure function to be called before plot or scatter function.
We can also load data from csv file or any other data source.
We can add multiple subplots in each figure, We can add multiple subplots in each figure, in the example below we learn how to add subplots and suptitle in any plot.
pyplot.figure(1)                # the figure 1
pyplot.subplot(211)             # the first subplot in figure 1
pyplot.plot([1, 2, 3])
pyplot.subplot(212)             # the second subplot in figure 1
pyplot.plot([4, 5, 6])
You can save any plot in pdf file, there are ready to use matplotlib.backends.backend_pdf package in matplotlib library.
Just three line of code, make sure you don’t forget to close the instance.
from matplotlib.backends.backend_pdf import PdfPages

pp = PdfPages('my-pdf-file.pdf')

# Save to the file
pp.savefig()
pp.close()
The imshow function in pyplot module of python matplotlib library, the function is used to display data as an image, here is a simple two lines codes to understand how to use the imshow function.
from scipy import misc
import matplotlib.pyplot as plt


face = misc.face()
plt.imshow(face)
plt.show()
The following raccoon picture is produced by above code.
Note: scipy.misc.face has been deprecated, all dataset methods are moved into the scipy.datasets. Use scipy.datasets.face. [I will update this section later]

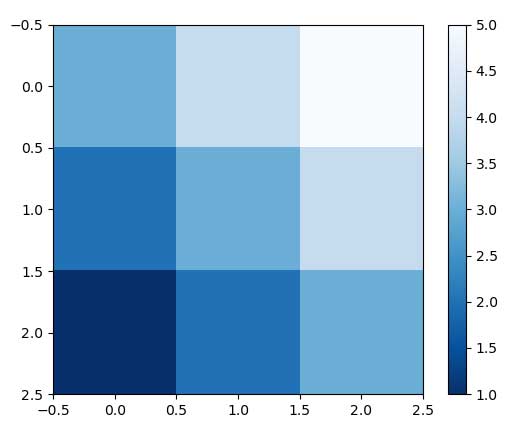
Here is another example of how we can use imshow function with array, and create a color chart by calling colorbar function.
import matplotlib.pyplot as plt
import numpy as np


arr1 = [[3, 4, 5],
     [2, 3, 4],
     [1, 2, 3]]

colorMap = plt.imshow(arr1)
colorMap.set_cmap("Blues_r")

plt.colorbar()
plt.show()

In progress
You may be interested in following tutorials

